<!--  第一条必须加,否则会导致 Could not autowire. No beans of 'xxxx' type found 的错误  -->
<dependency>
	<groupId>org.springframework.boot</groupId>
  <artifactId>spring-boot-starter-actuator</artifactId>
</dependency>
<dependency>
  <groupId>io.micrometer</groupId>
  <artifactId>micrometer-core</artifactId>
</dependency>
<dependency>
  <groupId>io.micrometer</groupId>
  <artifactId>micrometer-registry-prometheus</artifactId>
</dependency>
# HELP jvm_buffer_total_capacity_bytes An estimate of the total capacity of the buffers in this pool
# TYPE jvm_buffer_total_capacity_bytes gauge
jvm_buffer_total_capacity_bytes{id="direct",} 90112.0
jvm_buffer_total_capacity_bytes{id="mapped",} 0.0
# HELP tomcat_sessions_expired_sessions_total
# TYPE tomcat_sessions_expired_sessions_total counter
tomcat_sessions_expired_sessions_total 0.0
# HELP jvm_classes_unloaded_classes_total The total number of classes unloaded since the Java virtual machine has started execution
# TYPE jvm_classes_unloaded_classes_total counter
jvm_classes_unloaded_classes_total 1.0
# HELP jvm_buffer_count_buffers An estimate of the number of buffers in the pool
# TYPE jvm_buffer_count_buffers gauge
jvm_buffer_count_buffers{id="direct",} 11.0
jvm_buffer_count_buffers{id="mapped",} 0.0
# HELP system_cpu_usage The "recent cpu usage" for the whole system
# TYPE system_cpu_usage gauge
system_cpu_usage 0.0939447637893599
# HELP jvm_gc_max_data_size_bytes Max size of old generation memory pool
# TYPE jvm_gc_max_data_size_bytes gauge
jvm_gc_max_data_size_bytes 2.841116672E9

# 此处省略超多字...
二、Prometheus 安装与配置
使用 docker 运行 Prometheus(仅初始测试)
1
docker run --name prometheus -d -p 9090:9090 prom/prometheus:latest
# my global config global: scrape_interval: 15s # Set the scrape interval to every 15 seconds. Default is every 1 minute. evaluation_interval: 15s # Evaluate rules every 15 seconds. The default is every 1 minute. # scrape_timeout is set to the global default (10s).
# Load rules once and periodically evaluate them according to the global 'evaluation_interval'. rule_files: # - "first_rules.yml" # - "second_rules.yml"
# A scrape configuration containing exactly one endpoint to scrape: # Here it's Prometheus itself. scrape_configs: # The job name is added as a label `job=<job_name>` to any timeseries scraped from this config. - job_name: 'prometheus'
# metrics_path defaults to '/metrics' # scheme defaults to 'http'.
# HELP requests_error_total
# TYPE requests_error_total counter
requests_error_total{application="springboot-actuator-prometheus-test",status="error",} 41.0
# HELP order_request_count_total
# TYPE order_request_count_total counter
order_request_count_total{application="springboot-actuator-prometheus-test",order="test-svc",} 94.0
# HELP order_amount_sum
# TYPE order_amount_sum summary
order_amount_sum_count{application="springboot-actuator-prometheus-test",orderAmount="test-svc",} 53.0
order_amount_sum_sum{application="springboot-actuator-prometheus-test",orderAmount="test-svc",} 2701.0
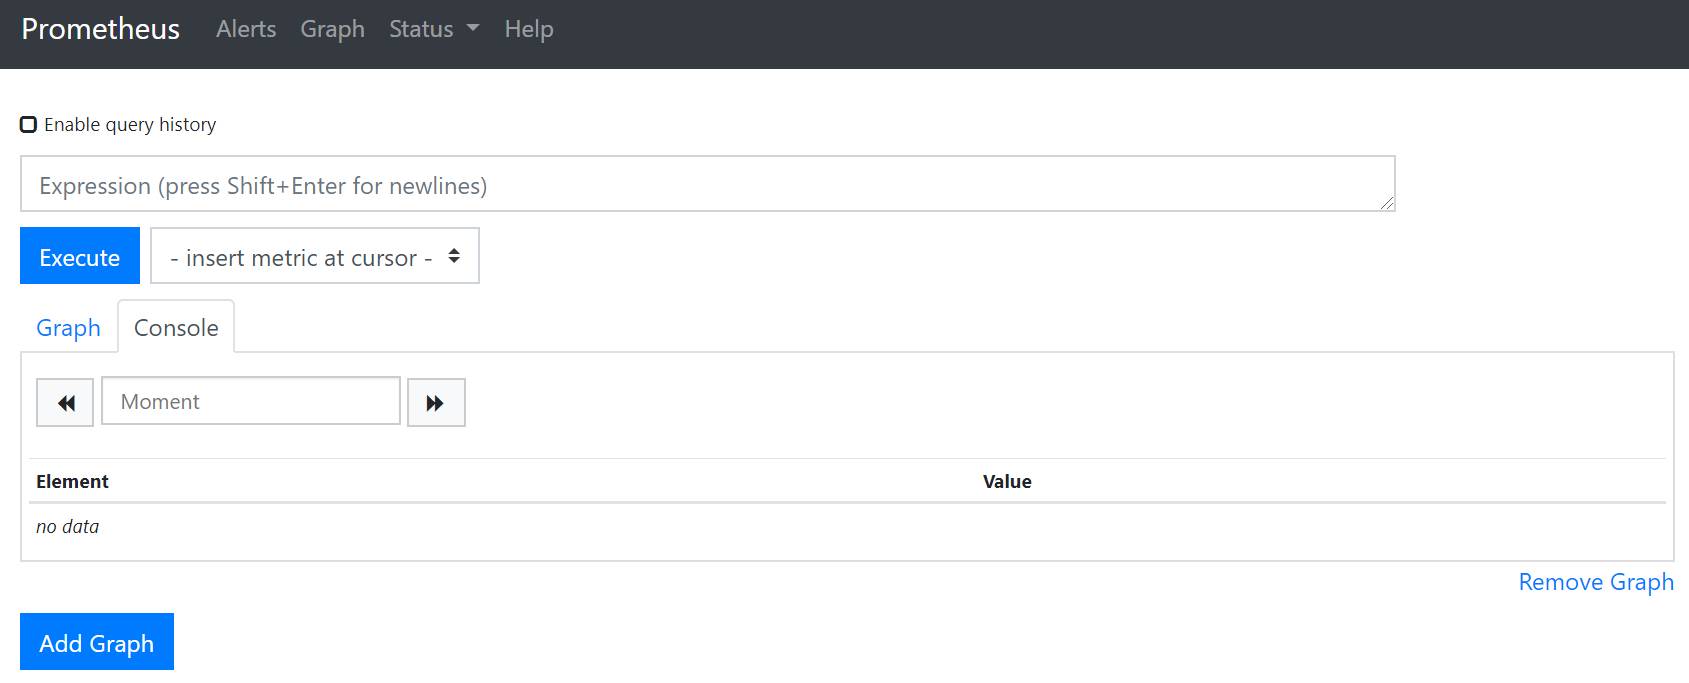
5、使用 Prometheus 监控
重新运行 docker
1
docker run -d -p 9090:9090 -v $(pwd)/prometheus.yml:/etc/prometheus/prometheus.yml prom/prometheus --config.file=/etc/prometheus/prometheus.yml